-
 Table 1: S Concentration
 -
 Figure 1: Calibration Curve. Typical calibration line based on calibration standards prepared with ultra high purity mineral oil (0, 10, 25, 50; 100, 250, 500 mg/kg)
 -
 Table 2: Determination of Cl using a water calibration
Analytical instrumentation
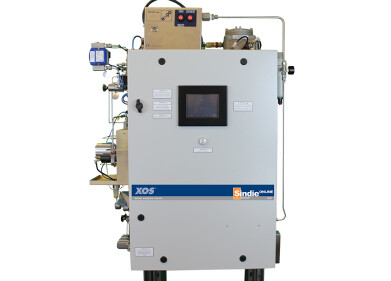
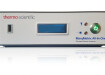
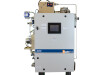
MESA 6000, Typical Results for S and Cl Analysis
Jan 27 2011
The new MESA-6000 by HORIBA Scientific is able to perform high sensitivity analysis of both Sulphur and Chlorine on the same instrument. Only one sample needs to be prepared, and it will be measured using the selected calibration curve. The customer is able to create and store as many calibration curves as he wants. Figure 1 shows a calibration curve made for Sulphur up to 500 ppm. On Table 1, some typical results obtained with this calibration curve are reported. To evaluate the standard deviation, 10 replicates have been done on each sample. With exactly the same simple operations, it is possible to build calibration curves for Chlorine. Some waste waters samples results are presented in Table 2. The standard deviations are excellent at all levels including very high concentration.

Digital Edition
PIN 25.6 Buyers' Guide
January 2025
Buyers' Guide Directory - Product Listings by Category - Suppliers Listings (A-Z) Articles Analytical Instrumentation - ASTM D7042: The Quantum Leap in Viscosity Testing Technology -...
View all digital editions


Events
Jan 20 2025 San Diego, CA, USA
Jan 22 2025 Tokyo, Japan
Jan 25 2025 San Diego, CA, USA
SPE Hydraulic Fracturing Technology Conference and Exhibition
Feb 04 2025 The Woodlands, TX, USA
Feb 05 2025 Guangzhou, China